CMDR Luriant profile
Profile

Commander name:
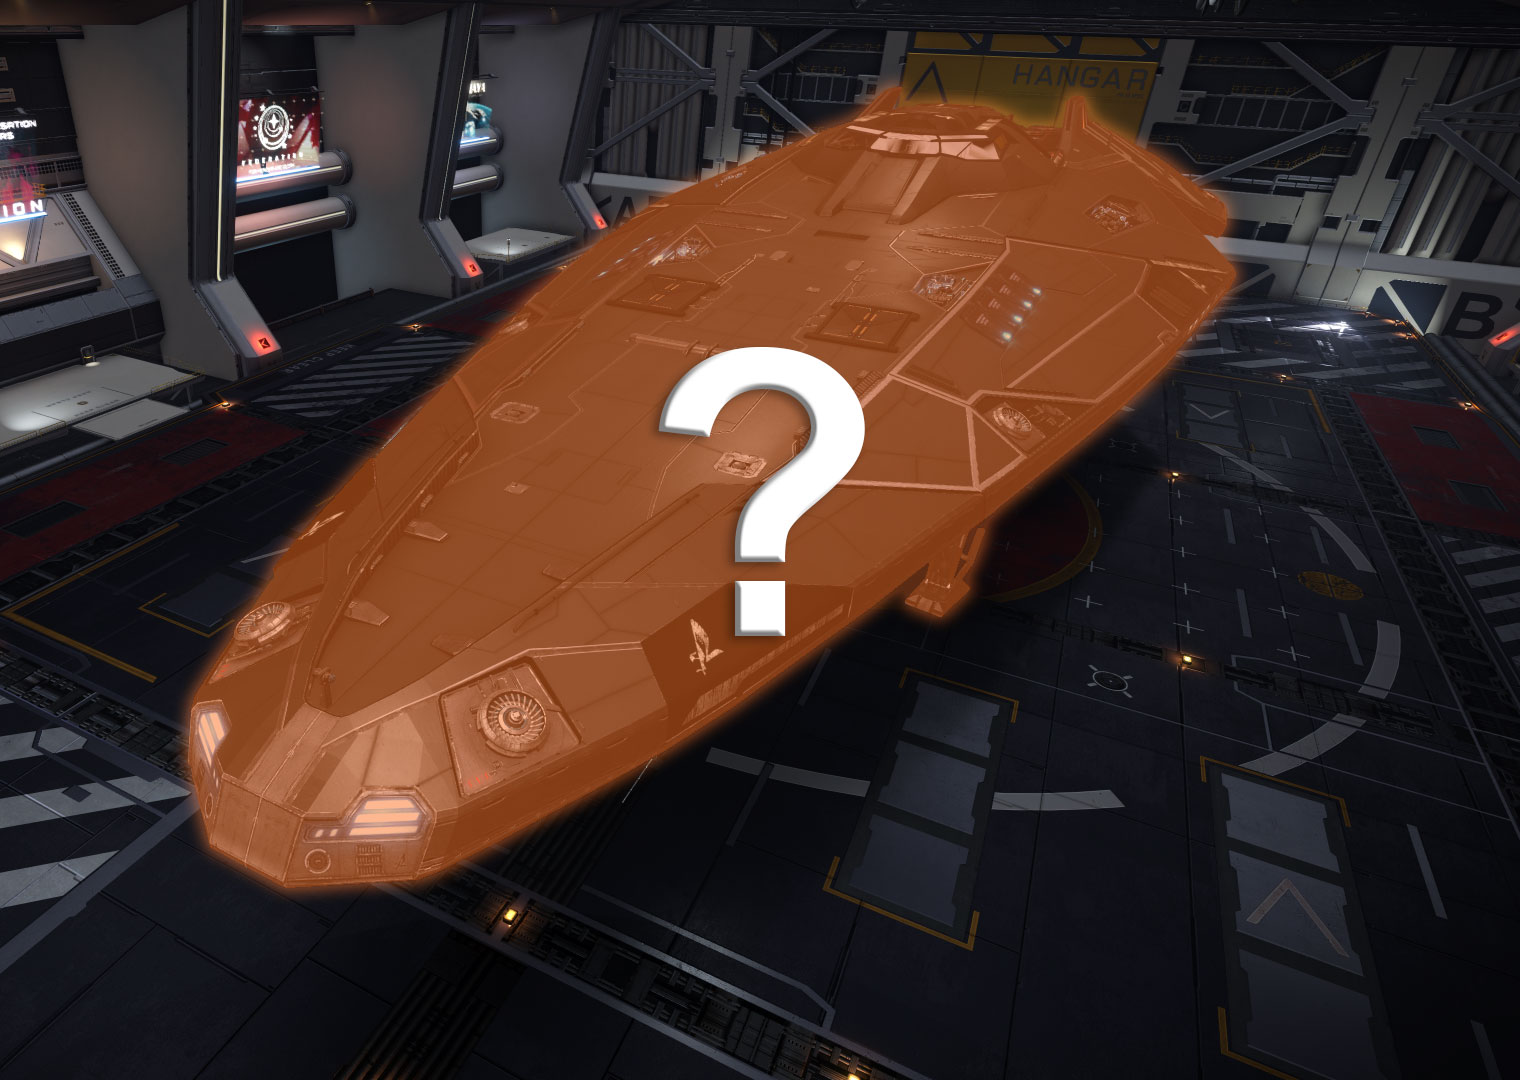
Current ship:
CRV Matterbeam [CANONN]
(Anaconda)
(Anaconda)
Member since:
19.2.2022
Distances submitted:
0
Systems visited:
10 434
Systems discovered first:
2 126
Balance:
34 925 522 567 Cr
Ranks
Elite V
Elite V
Federation: Admiral
Empire: King
Credits
Flight log heatmap
Statistics
Balance |
|
|---|---|
| Current assets | 49 449 392 692 cr |
| Credits spent on ships | 1 975 211 393 cr |
| Credits spent on outfitting | 390 820 879 258 cr |
| Credits spent on repairs | 108 253 936 cr |
| Credits spent on fuel | 2 351 316 cr |
| Credits spent on munitions | 29 528 012 cr |
| Insurance claims | 12 375 |
| Total claim costs | 5 276 423 115 cr |
Combat |
|
| Bounties claimed | 15 671 |
| Profit from bounties | 151 393 638 cr |
| Combat bonds | 25 918 |
| Profit from combat bonds | 10 099 566 612 cr |
| Assassinations | 27 |
| Profit from assassinations | 8 297 105 cr |
| Highest single reward | 1 000 000 cr |
| Skimmers killed | 183 |
Crime |
|
| Fines issued | 754 |
| Lifetime fines value | 11 050 171 cr |
| Bounties received/earned | 2 197 |
| Lifetime bounty value | 5 714 000 cr |
| Highest bounty issued | 36 600 cr |
Smuggling |
|
| Black market network | 7 |
| Black market profit | 1 752 281 cr |
| Commodities smuggled | 36 |
| Average profit | 175 228 cr |
| Highest single transaction | 1 563 072 cr |
Trading |
|
| Market network | 645 |
| Trading profit | 28 856 302 740 cr |
| Commodities traded | 2 575 799 |
| Average profit | 6 392 624 cr |
| Highest single transaction | 1 194 630 838 cr |
Mining |
|
| Profits from mining | 12 679 431 053 cr |
| Minerals refined | 42 103 |
| Materials collected | 39 275 |
Exploration |
|
| Systems visited | 12 565 |
| Profits from exploration | 2 419 757 655 cr |
| Level 2 detailed scans | 46 800 |
| Level 3 detailed scans | 46 798 |
| Highest payout | 12 231 637 cr |
| Total hyperspace distance | 971 626 ly |
| Total hyperspace jumps | 19 095 |
| Max distance from start | 65 616,70 ly |
| Max distance from Sol | 65 647,34 ly |
| Max distance from Colonia | 46 528,88 ly |
| Approximate time played | 32W 4D 7H 27M |
Passengers |
|
| Total bulk passengers delivered | 48 258 |
| Total VIPs delivered | 1 747 |
| Total delivered | 50 005 |
| Total ejected | 172 |
Search and Rescue |
|
| Total items rescued | 39 002 |
| Total profit | 3 337 753 380 cr |
| Total rescue transactions | 78 |
Crafting |
|
| Number of engineers used | 25 |
| Number of upgrades generated | 3 354 |
| Grade 1 upgrades generated | 511 |
| Grade 2 upgrades generated | 512 |
| Grade 3 upgrades generated | 655 |
| Grade 4 upgrades generated | 726 |
| Grade 5 upgrades generated | 950 |
Crew |
|
| Crew credits earned | 625 636 191 cr |
| Crew hired | 24 |
| Crew fired | 23 |
| Crew lost | 7 |
Multi-Crew |
|
| Total time in multi-crew | 3H 36M 45S |
| Time in gunner role | 1H 11M 7S |